Sequentum Cloud Open Developer Tools
Open Developer Tools is a highly valuable feature in Sequentum Cloud, providing real-time insights into the network activity and backend processes. This feature allows users to monitor network requests, responses and various other browser events as they occur in real time. It enables users to track and analyze data interactions between the client (browser) and the server, giving them a deep understanding of how their system behaves during web scraping or data extraction activities.
We have two ways to open the developer tools(attached screenshots for both ways below). By clicking the highlighted button in Sequentum Cloud, the Open Developer Tools panel will open, presenting a variety of tabs and options that mirror those found in Developer Tools. This environment is essential for troubleshooting, performance tuning and enhancing the accuracy of web scraping processes. It allows developers to inspect the data flow and interactions happening behind the scenes, ensuring that the scraping scripts are fetching the correct data and responding to unexpected issues or errors effectively.
Method 1:
Navigate to the Developer Tools by clicking the "Open Developer Tools" icon, as illustrated below.

Method 2:
Alternatively, you can access the Developer Tools by selecting the "Tools -> Dev Tools" option from the menu, as shown below:

Key Features of Developer Tools in Sequentum Cloud:
Network Monitoring: Users can monitor all the network requests being sent to the server, including HTTP requests, API calls and AJAX requests. This helps in understanding how the server responds to specific interactions and identifying any issues with data retrieval or performance.
Real-time Inspection: The Developer Tools allows users to inspect HTTP headers, response statuses and payloads, making it easier to debug issues and validate the accuracy of the collected data.
Performance Tuning: By viewing network timings and waterfall charts, developers can optimize data extraction processes by identifying slow network responses or any bottlenecks in the system.
Request Conversion: Users can easily convert network requests into formats suitable for any use in their editor. This is especially useful when capturing API calls that need to be integrated into data extraction scripts.
Error Debugging: In the case of unexpected results or errors in scraping, Developer Tools makes it easy to identify failing requests, check error responses and adjust scraping strategies accordingly.
Open Developer Tools Overview:
The Open Developer Tools (commonly referred to as Dev Tools) is a set of web authoring and debugging tools built directly into the Google Chrome browser. It provides developers with powerful capabilities to inspect the live front-end code of any website and monitor network interactions, allowing them to debug, test and optimize web applications.
Key Tabs in Chrome Developer Tools:
Elements Tab: Displays the Document Object Model (DOM) and allows users to inspect and modify HTML and CSS in real time. This is helpful when troubleshooting layout and styling issues.
Console Tab: Provides a powerful JavaScript console for running custom scripts, logging errors and debugging JavaScript code. It’s commonly used for viewing output and error messages.
Network Tab: Monitors all the network requests made by the browser, including requests for resources such as HTML, CSS, JavaScript, images and API data. The Network tab also provides detailed information on load times, request headers, responses and more, allowing developers to optimize website performance and identify bottlenecks.
Sources Tab: Allows developers to inspect the website's JavaScript files, set breakpoints and step through code execution to diagnose bugs or issues in the logic.
Performance Tab: Captures and visualizes website performance data, allowing users to analyze and optimize page load times and reduce rendering delays.
Application Tab: Lets developers inspect and manage website data such as cookies, local storage, session storage, and cached files. It’s often used for debugging issues related to data persistence and caching.
Security Tab: Provides information about the security of a website, including SSL/TLS certificates and mixed content warnings. This is essential for identifying potential security vulnerabilities on a page.
How Sequentum Cloud's Open Developer Tools Align with Chrome Developer Tools:
Sequentum Cloud’s Open Developer Tools closely mirrors the functionality of Chrome Developer Tools, offering a similar interface and features for inspecting network traffic, debugging code and validating data. This familiar environment makes it easy for developers to transition their debugging and inspection skills from Chrome DevTools to Sequentum Cloud's interface. With this tool, users can capture the exact same network requests and responses seen in a regular browser, ensuring accurate data extraction for their automation tasks.
In conclusion, Open Developer Tools in Sequentum Cloud is a critical feature for ensuring the efficiency and accuracy of web scraping operations. By leveraging this tool, users can enhance their ability to monitor and troubleshoot backend processes in real time, ultimately improving the reliability and performance of their data extraction workflows.
For Example, Below one is for the Economia website, where it is demonstrated about how we will monitor the request for the same for further usage in our agent.
To perform network monitoring using DevTools in the Sequentum Cloud Editor, follow the below steps for an efficient setup:
Open Developer Tools: Begin by clicking on the "Open Developer Tools" option in the Sequentum Cloud Editor (as shown in the initial screenshot).This will allow you to access advanced browser debugging tools.
Select the Network Tab: Once the DevTools panel opens, navigate to the "Network" tab. This tab provides a comprehensive view of all network activity, including backend requests sent to and from the website you are interacting with.
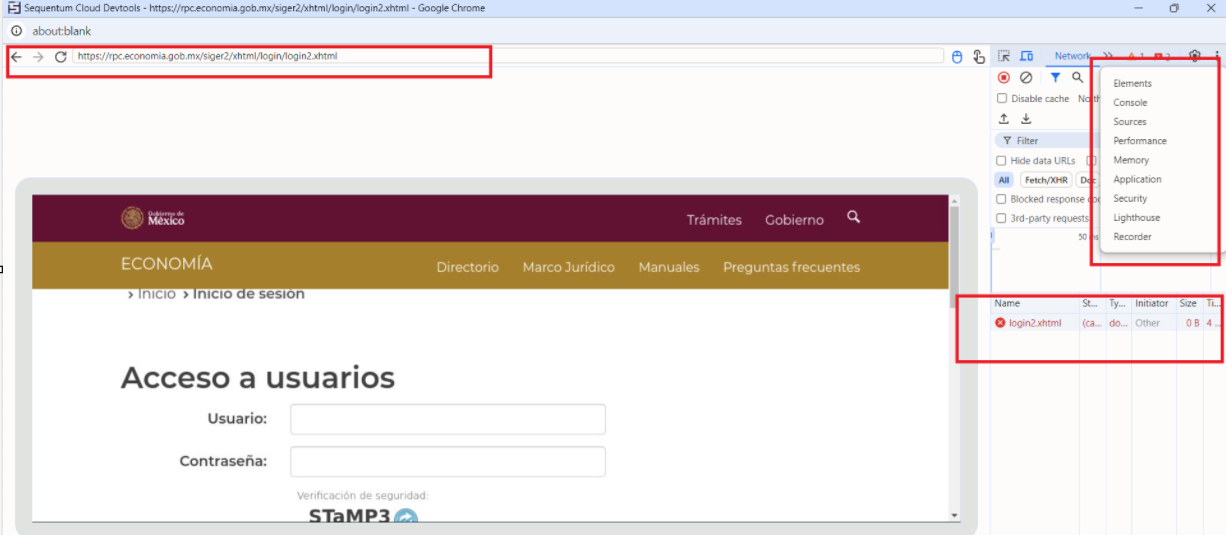

Monitor Backend Requests: In the Network tab, you'll see a list of all network requests made by the webpage. These include API calls, page assets and other types of requests essential for loading or interacting with the site.
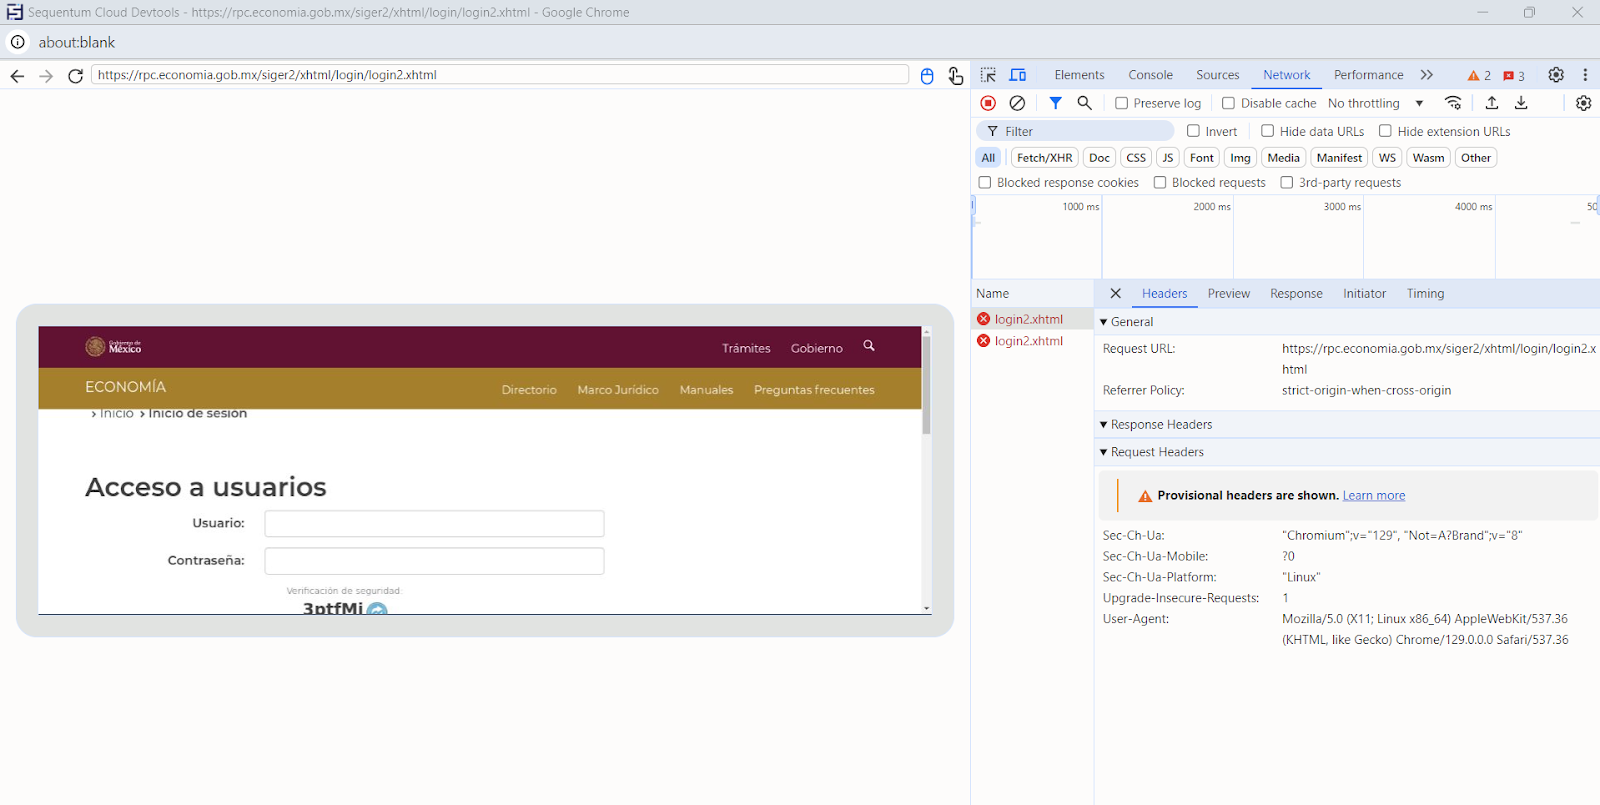
Copy the Relevant Request: Identify the specific request that you need for your scraping task. Once you have found the appropriate request, right-click on it and select the option "Copy as cURL(cmd)." This action will copy the full network request in a cURL format.

Use in Sequentum Cloud: The cURL command can now be pasted directly into the Sequentum Cloud Editor, allowing you to replicate that specific request in your web scraping agent, enabling accurate data extraction or testing of network interactions.
These steps streamline network monitoring, allowing you to capture and use backend requests directly within the Sequentum Cloud platform for enhanced control and customization in scraping workflows.