Migration, Monitoring and Compliance
Introduction
This document describes the migration process, monitoring, scheduling, compliance, and governance capabilities available in Sequentum Cloud.
Migrating Agents from Sequentum Enterprise to Sequentum Cloud
Sequentum Cloud includes a dedicated migration process that enables agents developed in Sequentum Enterprise to be converted and deployed in the cloud environment. This migration support helps organizations transition automation workloads with minimal rework by preserving logic, configurations, and data export settings where possible. The process covers converting agent files, adapting Enterprise-specific components to Cloud equivalents, and validating the migrated agent for cloud execution. This capability facilitates a smooth transition to cloud-native operations while maintaining continuity of existing automation assets.
For detailed steps and guidance on migrating agents from Sequentum Enterprise to Sequentum Cloud, refer to:
https://cloudsupport.sequentum.com/scm/converting-sequentum-enterprise-agents-to-sequentu
Monitoring and Compliance
Sequentum Cloud provides centralised visibility and operational control for all agents. Monitoring and compliance functions are accessible from the Agent interface through the following sections:
These features collectively ensure execution traceability, operational reliability, SLA adherence, and governance control.
Cloud Dashboard – Overview and Functionality
The Sequentum Cloud Dashboard provides a centralized operational overview of all agents across spaces. It displays a summary of total agents along with overall execution distribution (e.g., Success, Failed, Not Run), enabling quick assessment of system health. The dashboard highlights Run History trends, Upcoming Scheduled Runs, and lists of Recently Failed, Recently Run, and Recently Updated agents for rapid visibility into recent activity. It also presents a Space-level performance breakdown, showing execution statistics per space. This consolidated view allows administrators and operational teams to quickly monitor run status, identify failures, review scheduling activity, and assess overall platform performance without navigating into individual agents.
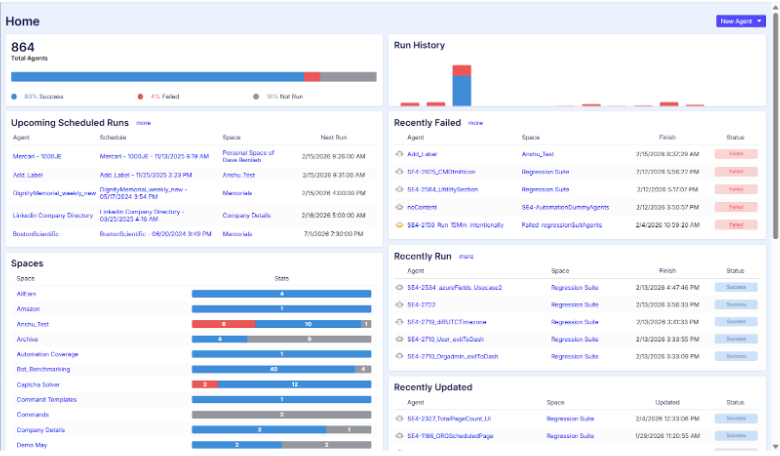
Cloud Dashboard
Organisation Runs – Overview
The All Runs screen provides a centralized view of all agent executions across the entire organization, regardless of space. It displays key execution details including Config Name (Agent), Server, Status, Created time, Run Time, Message, and execution statistics. Users can filter results by Status, Agent, or Space, and search by name to quickly locate specific runs. This view enables administrators and operations teams to monitor overall system activity, identify failures, track execution trends, and perform organization-wide troubleshooting from a single consolidated interface.
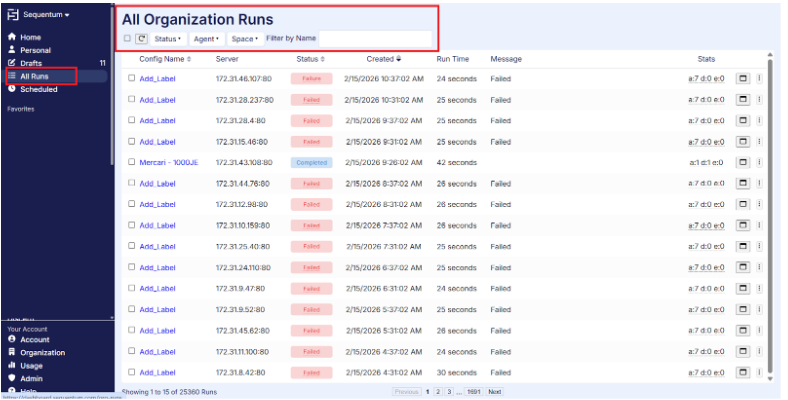
All Organisation Runs page
Organization Schedules – Monitoring Overview
The Organization Schedules page provides a consolidated view of all agent schedules configured across the organization. It displays key scheduling details including Agent name, execution Frequency, Next Run time, Last Run time, and current Status. Users can filter schedules by Enabled state, Status, or Agent, and search by name to quickly locate specific entries. This view enables administrators to monitor upcoming executions, verify scheduling configurations, track recent schedule outcomes, and identify failed or inactive schedules. It serves as a centralized monitoring interface to ensure scheduled automation is running as expected across all spaces.
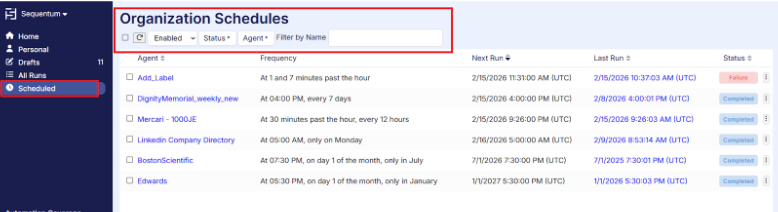
Organization Schedules Overview
Usage – Organization Monitoring Overview
The Usage page provides a comprehensive view of resource consumption across the organization. It displays subscription details, available On-Demand Credits, and total credits used for the selected period. Users can analyze usage based on a custom date range, with graphical representation of daily cost trends and breakdown by usage type (e.g., Server Time, Proxy Data, Export GB, Agent Inputs). The page also presents Usage Totals for each resource category and an Agent-wise cost distribution, enabling detailed cost analysis per agent. By clicking on an agent name, users can drill down into agent-specific usage metrics for more granular monitoring. This centralized view helps administrators track consumption patterns, monitor budget utilization, and manage subscription and credit usage effectively.
For detailed information about usage, refer to the documentation link
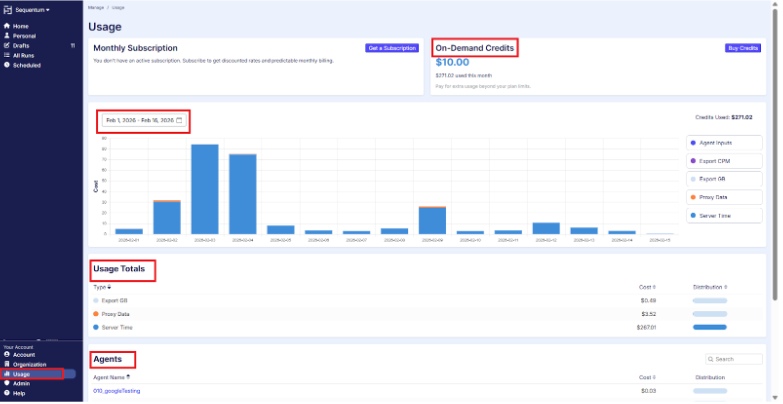
Organisational level usage
Usage details for a specific agent
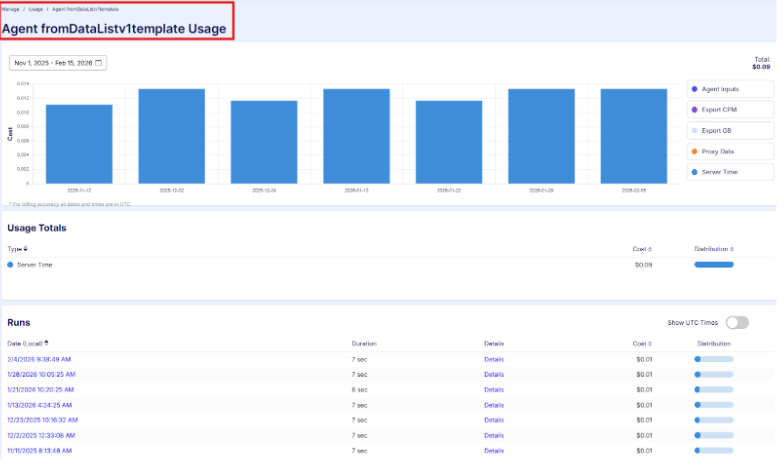
Agent-level usage screen
Audit – Organization Level Monitoring
The Audit section, accessible only to Organization Administrators, provides centralized visibility into key system and user activities across the organization. It includes dedicated audit views such as Audit Logs, Audit Agents, Audit Runs, and Audit Logins, enabling administrators to track configuration changes, agent modifications, execution activities, and user access events. This section supports governance, security monitoring, compliance verification, and operational traceability by maintaining a structured record of critical actions performed within the platform.
For detailed information about each audit type and its scope, please refer to the Audit documentation link provided in the manual.
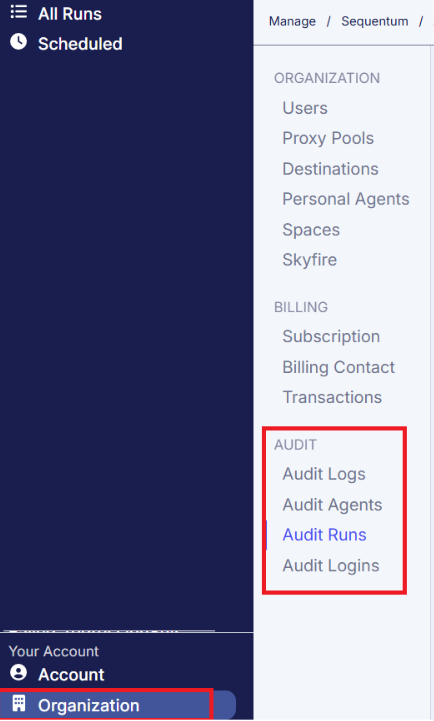
Audit Log Screen
Data Validation & Success Criteria
Data Validation(Export Schema)
The Export Schema screen provides centralized control over the agent’s output structure and serves as a key component for data validation and compliance monitoring in Sequentum Cloud. This view allows users to define and review the data table schema, including field names, content types, format settings, time zone handling, and empty value permissions. By enforcing a structured schema, organizations can ensure consistent data output, maintain downstream compatibility, and prevent unintended schema changes. This capability supports governance requirements by enabling validation of output fields prior to execution and helping maintain auditability of data structure changes.
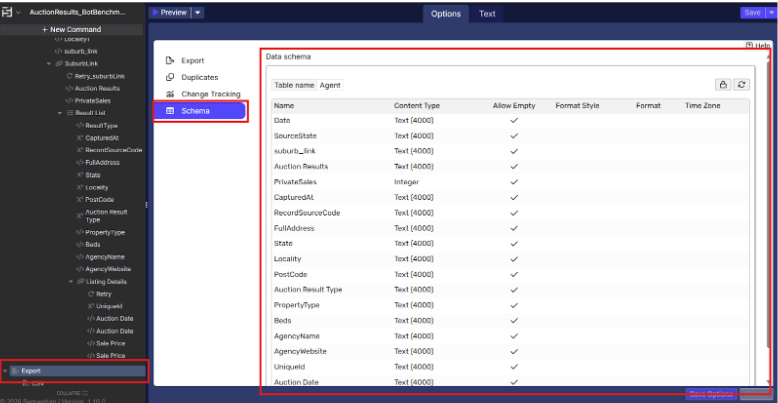
Export Schema Screen
For detailed configuration guidance and field-level settings, refer to the Export Schema documentation:
https://cloudsupport.sequentum.com/scm/export-schema
Success Criteria – Execution Quality Controls
The Success Criteria page in Sequentum Cloud allows users to define validation thresholds that determine whether an agent run is considered successful, partially successful, or failed. These controls help monitor execution consistency and detect abnormal variations in crawl or extraction results.
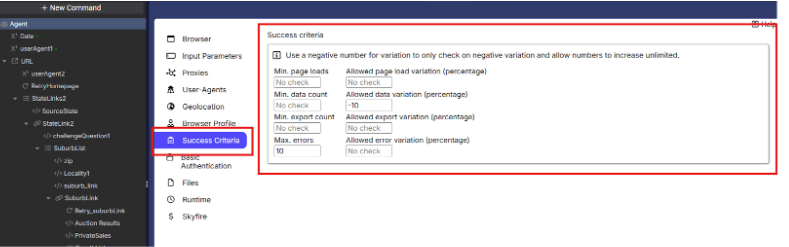
Success Criteria
Minimum Page Loads – Defines the minimum number of pages that must be successfully loaded during execution. If the run loads fewer pages than specified, it may be flagged as failed.
Allowed Page Load Variation (%) – Controls acceptable percentage deviation in page loads compared to previous successful runs. A negative value checks only for downward variation (allowing increases without limit).
Minimum Data Count – Specifies the minimum number of records/items that must be extracted for the run to be considered valid.
Allowed Data Variation (%) – Sets the acceptable percentage increase or decrease in extracted data compared to historical results. Negative values validate only negative deviation.
Minimum Export Count – Ensures that a minimum number of records are successfully exported to the destination.
Allowed Export Variation (%) – Monitors percentage variation in exported records to detect unexpected drops or spikes.
Maximum Errors – Defines the maximum number of allowable execution errors before the run is marked unsuccessful.
Allowed Error Variation (%) – Controls acceptable deviation in error volume compared to prior runs.
These parameters provide proactive monitoring, helping teams detect site structure changes, extraction failures, data loss, or abnormal performance variations before they impact downstream systems.
Error Handling and Alerts
Sequentum Cloud provides built-in Error Handling and Alerting capabilities to support operational monitoring and compliance requirements. Error handling settings allow users to control how agents respond to runtime issues, including retry behavior, failure thresholds, and execution controls to prevent incomplete or invalid data processing. In addition, configurable Email Alerts enable proactive notification of failures, warnings, or abnormal execution outcomes, ensuring that operational teams are immediately informed of issues requiring attention. Together, these features help maintain data integrity, improve incident response times, and support governance by ensuring execution transparency and traceability.
For detailed configuration guidance, refer to:
Error Handling:https://cloudsupport.sequentum.com/scm/error-handling
Configuring Agent Email Alerts:https://cloudsupport.sequentum.com/scm/configuring-agent-email-alerts-with-sequentum-clou
Remove Duplicates – Data Quality Control
Sequentum Cloud provides a Remove Duplicate capability to help maintain data accuracy and consistency by preventing duplicate records from being exported or stored. This feature allows users to define one or more key fields that uniquely identify a record, ensuring that repeated entries—whether caused by pagination overlap, site structure changes, or repeated runs—are automatically filtered out. By enforcing uniqueness at the export stage, organizations can protect downstream systems from data inflation, reporting inaccuracies, and compliance risks related to redundant data.
For detailed configuration steps and usage guidance, refer to:
https://cloudsupport.sequentum.com/scm/remove-duplicate
Space Navigation and Agent Management
By selecting a Space name from the left navigation panel, users can access the dedicated Space view, which displays all agents contained within that Space. The Space dashboard provides a summary of total agents, files, templates, and overall execution status, along with recent activity insights. Within this view, users can search, filter (by Status, Label, or Template), and review agent details such as version, last updated date, recent activity, and execution status. From here, users can perform further operations including editing agents, running them manually, scheduling executions, reviewing run history, and managing configurations. This structured Space-level organization enables efficient management, monitoring, and governance of related agents within a single logical grouping.
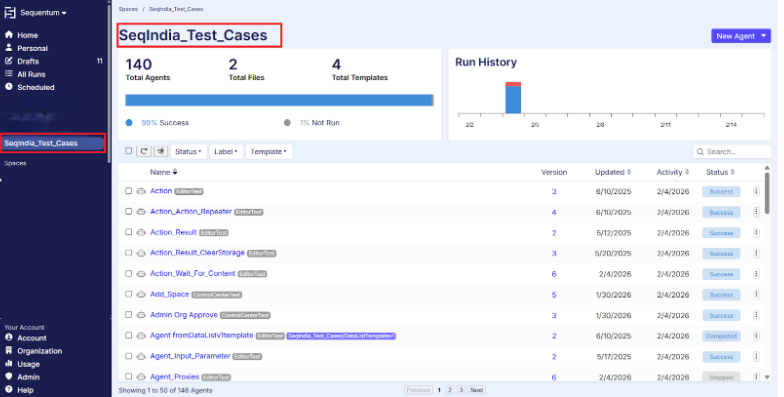
Space Navigation
Agent Execution Monitoring
Runs (Live Monitoring)
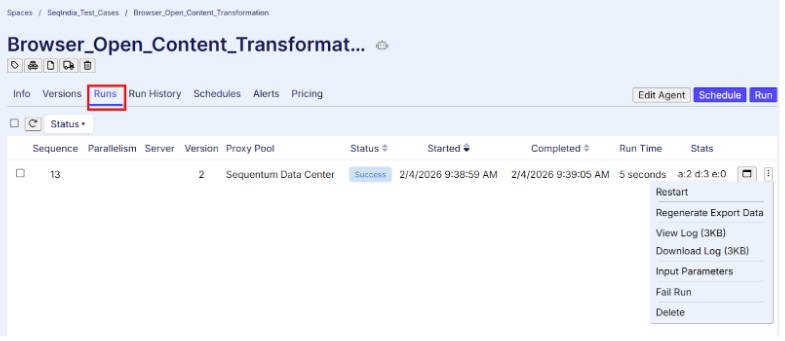
Agent Run Screen
The Runs tab provides real-time visibility into agent executions, including:
Status (Queued, Running, Completed, Failed, Cancelled)
Server and Proxy Pool
Version executed
Start time, completion time, and runtime
Execution statistics
Purpose:
Detect failures or stalled runs
Validate correct version and environment
Monitor performance
2. Run History (Audit Trail)
The Run History tab maintains a complete record of past executions.
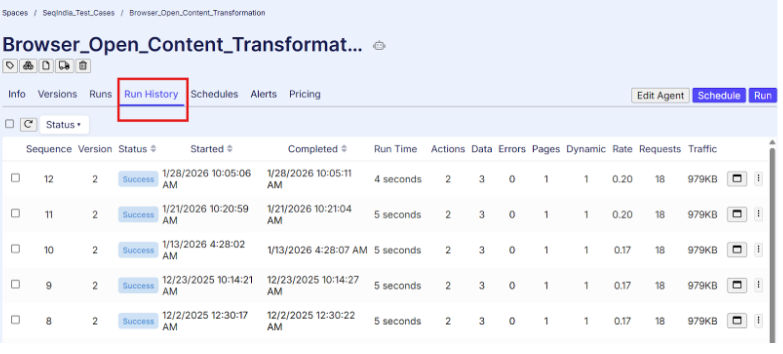
Agent Run History
Capabilities:
Filter by date, version, or status
Access logs and error details
Review failure trends
Compliance Value:
Maintains audit trail
Supports SLA validation
Enables root cause analysis
3. Scheduling Governance
Schedules
The Schedules tab controls automated execution.
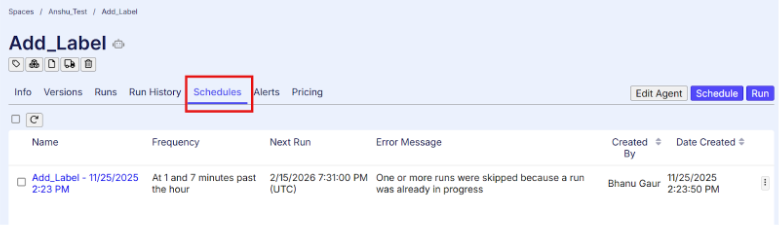
Agent Schedule Screen
Capabilities:
Configure recurring schedules (Hourly, Daily, Weekly, Custom CRON)
Set timezone
Enable, modify, or disable schedules
Purpose:
Ensure predictable execution
Prevent unauthorized runs
Align with business and SLA requirements
4. Alerts and Incident Management
Alerts
The Alerts tab enables proactive monitoring of operational issues.
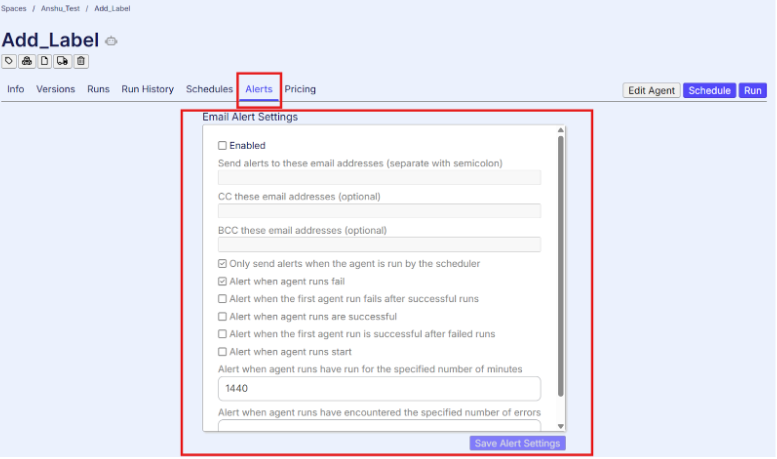
Agent Alert Configuration
Common Alerts:
Run failures
Repeated failure thresholds
Excessive runtime
Missed schedules
Purpose:
Early issue detection
Reduced downtime
SLA protection
Structured incident response
Alerts should be configured for all production agents.
5. Version Control
Versions
The Versions tab supports controlled deployment.
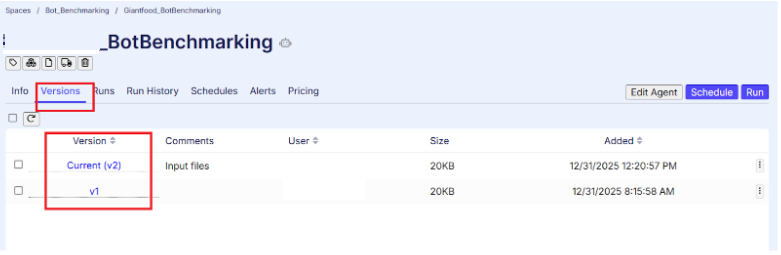
Versioning Screen for Agent
Capabilities:
Track published versions
Identify version executed per run
Rollback if required
Purpose:
Maintain change history
Prevent unauthorized modifications
Support release governance
6. Cost and Resource Monitoring
Pricing
The Pricing tab provides visibility into resource usage and execution cost.
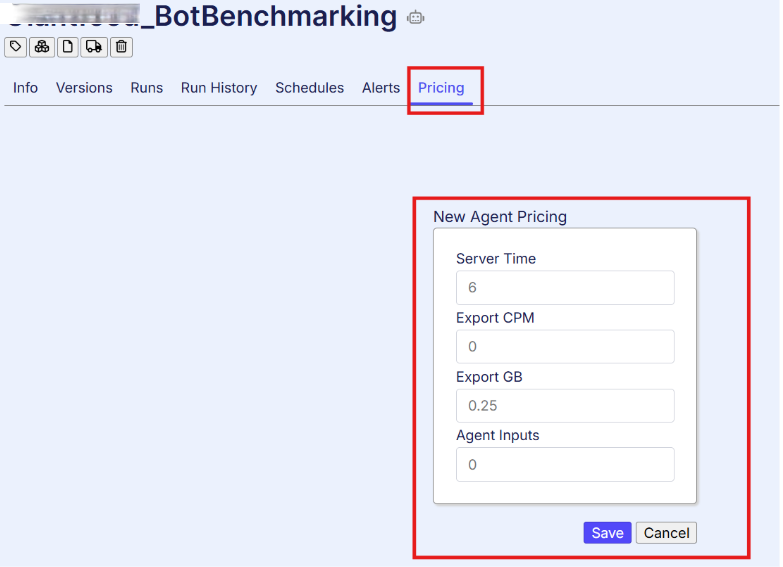
Pricing Screen For Agent
Purpose:
Monitor compute consumption
Prevent cost overruns
Support operational reporting
7. Logging and Data Integrity
Sequentum Cloud provides execution logs and error details to support:
Troubleshooting
Audit requirements
Performance analysis
Data quality should be monitored through:
Record count validation
Schema checks
Output consistency review
8. Security and Access Control
Sequentum Cloud enforces:
Role-based access control (RBAC)
Restricted scheduling and publishing rights
Audit trail of configuration changes
Production access should be limited to authorized roles.
Summary
Sequentum Cloud provides a comprehensive framework for agent migration, monitoring, and compliance governance. It enables structured migration of agents from Sequentum Enterprise while preserving logic and configurations, ensuring a smooth transition to the cloud environment. The platform delivers centralized monitoring through dashboards, run history, schedules, usage tracking, and audit logs, providing full execution visibility and traceability. Integrated data validation controls, success criteria, error handling, alerts, and duplicate management help maintain data quality and operational reliability. Together with role-based access control and version management, these capabilities ensure SLA adherence, security, cost oversight, and enterprise-grade compliance across cloud-based automation workloads.